
How many calls does your contact centre receive every week? How many of these calls were first time callers who had their enquiry resolved? How do your customers feel about their experience? How productive are your agents? These questions are all solved through capturing and evaluating contact centre metrics.
Those who oversee the operations of a contact centre closely monitor metrics to identify areas of excellence as well as the aspects that require enhancements.
Tracking an extensive range of metrics can be challenging, so we have identified the key metrics that offer valuable insights into your contact centre operations, agent productivity and the customer experience. Keep reading to discover the essential metrics you should capture, measure and report on.
What are contact centre metrics?
Contact centre metrics are the key performance indicators (KPIs) that are tracked and measured to evaluate the success and efficiency of a contact centre. Managers use these metrics to analyse agent productivity, monitor the quality of the customer experience and understand how efficient the contact centre operates.
Understanding contact centre performance metrics – why are they important?
Contact centre metrics reflect how successful your contact centre is performing. Without these metrics, it is almost impossible to gauge the true success of your contact centre operations.
At the core, collecting and analysing these metrics will help you understand:
- how many customers contact your business
- the time it takes for your contact centre agents to respond to customers
- the efficiency of your contact centre department in resolving customer enquiries
- how satisfied your customers are with their experience
- areas for improvement
By utilising the performance data, managers can develop targeted strategies aimed at exceeding contact centre KPIs.
What are the industry standard contact centre metrics?
Contact centre metrics are unique to each business – a contact centre that provides IT support with strict SLA’s will monitor different metrics compared to a business that makes outbound calls tasked to meet sales targets each week. However, there are some universal metrics that managers should track, measure and report on. These can be divided into three categories:
- Agent productivity metrics
- Contact centre operational metrics
- Customer experience metrics
Agent Productivity Metrics
Productivity metrics are based on call records and used by management to review each individual’s performance. The data points collected are crucial in forming tailored action plans aimed to improve each agent’s performance.
Here are the top agent productivity metrics to be aware of:
Average Speed to Answer (ASA)
ASA indicates the average amount of time it takes for your agents to answer inbound phone calls. Generally, the shorter your ASA is the higher your service level is, which can result in minimal abandoned calls and better customer journeys.
To keep ASA down, customer service managers can utilise advanced call routing tools to streamline the caller’s experience and conduct training sessions to ensure each call centre agent’s skillset is well aligned to serve customers as quickly as possible.
Agent Occupancy Rate
Agent Occupancy denotes the percentage of time your agents spend on call-related activities while working.
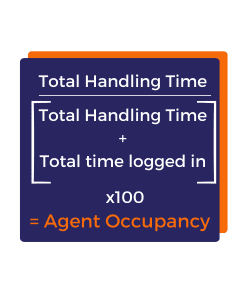
A higher occupancy rate means agents spend little time throughout their day between interacting with customers and completing post-call work. In contrast, a lower occupancy rate means your agents have a significant amount of downtime between calls. This may be a sign that your contact centre has too many staff rostered on compared to the number of incoming calls received. An ideal agent occupancy rate to aim for is around 80%, ensuring agent workload is sufficient but not to the extent that will lead to burnout.
Average After-Call Work Time (AWT)
After-call work time reflects how long it takes for an agent to complete post-interaction tasks such as writing a summary of the call, selecting the wrap code (outcome of the call), next steps and any other additional details worth noting based on their conversation with the customer.
The latest innovations in cloud contact centre software can help you reduce average AWT through using AI-generated post-call summarisation. This functionality completes after-call administration work that is typically completed by an agent, ultimately saving valuable time and enabling agents to speak with the next customer faster, contributing to a more productive contact centre department.
Contact Centre Operational Metrics
Contact centre management utilise operational metrics to assess how optimal the contact centre is performing. The results allow management to unlock new trends, effectively forecast staffing requirements and determine whether the contact centre software is enhancing the efficiency of the contact centre.
The core operational metrics to monitor are:
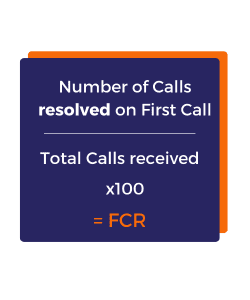
First Call Resolution (FCR) rate
FCR rate shows the percentage of customer calls that were resolved the first time customers made contact, without the agent needing to pause, transfer or return the call. A high FCR rate means your agents are well trained to resolve a wide range of customer enquiries, which can contribute to a more efficient contact centre as well as increased customer satisfaction – so the higher the FCR, the better.
Some businesses prefer to measure Repeat Call Rate (RPC) which inversely shows First Contact Resolution rate through identifying the percentage of customers that called multiple times to have their enquiry resolved. In this case, the lower the RPC, the better.
Average Call Abandonment Rate
Average call abandonment rate is found as a percentage of the total number of inbound calls received where the customer hangs up the phone before their call is answered by a human agent.
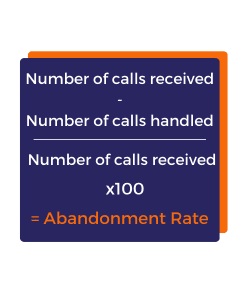
A high abandonment rate indicates your contact centre is operating inefficiently, which can lead to customer dissatisfaction and churn. To ensure your abandonment rate stays as low as possible, you can consider:
- Optimising your IVR workflows – assess whether there are too many confusing menu options that cause callers to end the phone call
- Deflecting calls to Virtual Agents – enable customers to avoid waiting in the queue through providing self-service options where they can resolve their own enquiry
- Implement ‘Maintain Position in Queue’ – allow customers to make callback requests where they can hang up the phone and receive a call from an agent once they reach the front of the queue.
Average Time in Queue
This metric can be difficult to assess since the amount of time customers spend in the queue is dependent on the call volume each hour, which can often fluctuate. During peak hour traffic, your call centre will likely receive an increase in calls than normal, so in order to keep average time in queue low, contact centre agents should aim to reduce each interaction’s handling time.
If you find customers complain frequently about long wait times, this may be a sign you do not have enough staff rostered on to handle call volumes. To address this, customer service leaders may choose to implement AI-powered Virtual Agents, allowing customers to self-serve. In doing so, customers do not need to wait in the queue to speak with a human agent, resulting in decreasing the average time spent in queue metric.
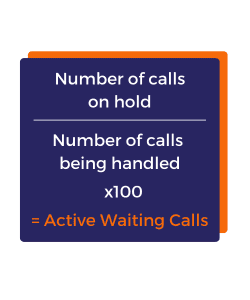
Active Waiting Calls
This is a real-time measurement of how many calls answered are either on hold or are actively being handled by an agent. Active waiting calls offers insights into the effectiveness of your customer service team through indicating how efficient they are at handling customer interactions and coping with call volumes. If you find the number of customers on hold is more than the number of calls being actively handled, this is something to improve on as keeping customers on hold for a lengthy period of time can create a negative customer experience and result in a lower retention rate.
To improve your active waiting calls score, consider hiring more agents to meet call volume, conduct training sessions to enhance agent performance or utilise AI self-service to enable customers to resolve their own enquiry. Each of these approaches can reduce the number of callers waiting on hold, to improve the efficiency of the contact centre.
Cost Per Call (CPC)
CPC is a price of two functions – the contact centre software used and the length of each call. Off the back of this, the longer the interaction, the more expensive the cost becomes. Yet, a longer interaction can result in a higher first contact resolution rate and minimise the chance of repeat calls, which ends up saving money. A high CPC indicates there is some form of operational inefficiency – it could be the contact centre software, the length of time it takes your agents to help a customer or a combination of both.
An ideal Cost Per Call is entirely dependent on your business – the size of your contact centre, the complexity of your product, the nature of the buying process and the type of service you’re providing. By adding the costs of the software, labour, and any other expenses that support the operations of your call centre, divide it by the total number of calls and this will be your CPC. Use this statistic to determine how to effectively decrease operational costs.
Percentage of Calls Blocked
When your customers try to make contact with your call centre team and they reach a busy signal, it is most likely because the phone number has been ‘blocked’. Customers may receive a busy tone due to a lack of agent availability from there being too many calls in the queue, the contact centre software does not scale according to call volume, or the inbound call volume exceeds the set threshold.
It is important that you regularly monitor the percentage of calls blocked and keep an eye on whether this figure increases. As you can imagine, customers who simply cannot get in touch with a service representative for assistance can endure frustration and have a poor customer experience.
Customer experience metrics
Satisfying customer needs is fundamental to the success of your organisation. Are you aware of how well your organisation is meeting customer expectations? How satisfied customers are using your products and services is a significant indicator of whether their experience is positive, negative or somewhere in between. By leveraging contact centre metrics, you can effectively track and evaluate both the quality of the customer experience and level of customer satisfaction.
Here the key customer experience metrics to monitor:
Customer Satisfaction (CSAT) score
Measuring CSAT reveals how satisfied your customers are with using your business’s products or services. CSAT scores can be obtained through launching a post-interaction survey, which can be completed either over the phone, or via a link sent to the customer’s mobile number or email address.
An example of a customer satisfaction survey question is, “How satisfied are you with the customer service you received?” The higher the number of satisfied customers, the better position your company is in to secure repeat sales and foster stronger loyalty.
Net Promoter Score (NPS)
NPS enables you to gauge customer loyalty by assessing their likelihood to recommend your business’s products or services. NPS surveys are typically deployed after an interaction, asking, “On a scale from one to ten, how likely are you to recommend our products and services to your friends and family?”
Under the NPS framework, customers who provide a rating between 9-10 are classified as ‘promotors’, scores between 7-8 are ‘passives’ and scores ranging from 1-6 are ‘detractors’. The more promotors your business has means your business is exceeding customer expectations and satisfying their needs. Conversely, a large quantity of detractors signals a need for your organisation to urgently address customer concerns to mitigate risks such as churn. For example, you can leverage contact centre software and the platform’s APIs to trigger an action based on an event. This capability is especially helpful to initiate proactive customer engagement if an NPS score is provided that is below 7. The contact centre system can be configured to trigger a call to a customer almost immediately after the rating is captured. This functionality allows a service representative to acknowledge the customer’s feedback and proactively address their concerns with the intention of improving their satisfaction.
Customer Effort Score (CES)
CES is a single question that measures how much effort was required by a customer to have their query resolved. Customer effort can be measured through asking, “On a scale from one to five, one being the most difficult and five being very simple, how easy was it to solve your enquiry today?”
The more effort a customer needed to exert, the more negative their experience tends to be. A high CES is desirable as this indicates your customers find it easy to interact with your organisation, which can result in higher CSAT scores and more loyal customers.
How to improve your contact centre metrics:
Gathering metrics is one thing, but how do you implement strategies that not only improve these figures but also boosts the overall efficiency and effectiveness of contact centres? Let’s explore some of the ways you can improve the performance of your contact centres.
Historical Performance Analysis
Evaluating past performance is essential for setting clear and attainable goals. By analysing historical data, you can uncover patterns, derive actionable insights and surface improvement areas. In doing so, this enables key stakeholders to develop tailored strategies to address the areas for improvement. As an example, if the historical data reveals a pattern of spikes in call volume during the first week of every month, management can apply these findings by adjusting staffing levels to accordingly handle future volume. This proactive measure could substantially reduce average time spent in queue, minimise the number of abandoned calls and ultimately increase customer satisfaction scores.
Empower your agents
Agents play a major role in contributing to the improvement of contact centre metrics. It is important they feel empowered, recognised and rewarded for their performance. Using contact centre software that is equipped with Natural Language Processing (NLP) and Artificial Intelligence (AI) allows for real-time agent monitoring where sentiment, emotion and intent is identified. The real-time recognition of agent emotions prompts staff with contextually relevant suggestions to improve the service delivery. For instance, if a customer asks a complex question where the software recognises the agent feels the emotion of stress, suggestions are made to facilitate a fast, yet correct response. This innovative technology can boost first call resolution rates and reduce average handle time.
Share call centre metrics with staff to drive performance
Providing transparency across contact centre kpis can provide your agents with a sense of ownership to enhance their own performance which can assist in meeting organisational targets. Displaying key reports in the office, over email or on a group chat enables staff to visualise how well the team is tracking to meet kpis, which can create a sense of urgency and drive to enhance their performance.
Factoring AI into your metrics
AI is rapidly transforming existing contact centre processes, enabling organisations to improve their outputs. For example, AI-driven Virtual Agents offer customers the ability to self-serve which contributes to reducing average time in queue and increasing FCR rates. Additionally, Generative AI is now automating the process of post-call administration work by transcribing customer conversations and generating accurate call summaries. This innovation decreases Average After-Call Work Time (AWT), facilitating agents to serve subsequent customers quicker, which can assist in improving the metric, Average Speed to Answer (ASA).
Understand your contact centre metrics with ipSCAPE’s reporting module and analytics
The ipSCAPE cloud contact centre solution provides an array of reports, analytics and highly visual wallboards that support organisations to form business-critical decisions. The contact centre solution integrates with leading Business Intelligence (BI) tools such as Power BI and Tableau that enables senior management to visualise customer interactions and make smarter decisions, faster.
ipSCAPE’s reporting module allows businesses to:
- Access many pre-built reports that instantly reveal key metrics
- Build and create custom reporting templates
- Share reports with internal team members as well as extract the data into files such as a CSV
If you’d like to discover how you can use contact centre software to understand your contact centre metrics, monitor agent performance and gain valuable insights into the quality of customer experiences, contact us to find out how ipSCAPE’s feature-rich, award-winning cloud contact centre solution can help your organisation effectively measure performance and track contact centre kpis.
ipSCAPE enables organisations to create incredible customer experiences through a powerful, easy-to-use platform that provides access to the communication channels of today and the future.
AI technology is embedded within the application to make it accessible for all organisations to create customer journeys that better serve customers, increase sales and deliver operational efficiencies.
Organisations use ipSCAPE’s communication technology platform to unlock growth by building personalised communication with customers at scale, through their channel of choice.